

How to Debug your Laserfiche Workflow Design
Administrators: learn how to investigate and diagnose issues in your Laserfiche Workflow designs.
Laserfiche Workflow is a wonderful tool for automating business processes within your organization, yet sometimes even the most thought-through workflows can function in unexpected ways. Although some of these problems may be related to hardware or software configuration, a large number of them are due to non-optimal workflow design.
Here are some suggestions for debugging your workflow designs when:
- Your workflow is not working as expected.
- Your workflow is not starting.
- Too many instances of the same workflow are starting.
In order to diagnose your problem, you can use three different tools, each of which is described in more detail in the sections below:
- Laserfiche Workflow 8.3 search.
- Subscriber trace.
- Workflow statistics report.
Scenario 1: Your workflow is not working as expected
When investigating why a Laserfiche Workflow definition (a Workflow design) is not working as expected, it is important to first find the workflow instance that pertains to the specific entry. The easiest way to do this is using Laserfiche Workflow 8.3’s built-in search functionality. Simply navigate to the “Search” pane in the Workflow Designer and configure a search for the most recent running instance of the workflow in question.

Example: You have created a workflow (named “Workflow 1″) that is supposed to route invoices from the “Invoices – Incoming” folder to the “Invoices – Approved” folder after they are approved by Purchasing and by Accounting. You realize that the invoice you just scanned into Laserfiche is not showing up in the “Invoices – Approved ” folder, even though it has disappeared from the “Invoices – Incoming” folder.
After searching for the most recent instances of Workflow 1, you will see the following results:

Click image to view larger in a new window.
Identify the workflow instance that you are interested in and double-click it to see its “Instance Details”. Each tab displays different information that you can use for troubleshooting.
- The “Workflow” tab presents a color-coded, visual representation of where the document is in the actual workflow. Different colors signify different things (i.e. green corresponds to “Completed”, blue to “Running” and yellow to “Has Warning”). This view is helpful in identifying where a document is stuck inside a workflow. You can then view the activity properties and identify any possible configuration errors.For example, in this workflow, you can see that the particular invoice has been approved by Purchasing and is now waiting to be approved by Accounting before it moves to the next steps.


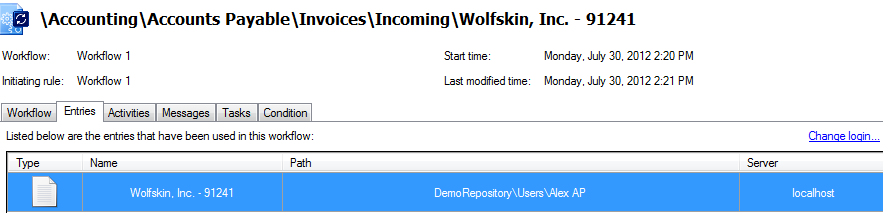
- The “Entries” tab displays all of the entries that the workflow instance has interacted with. This tab is helpful in checking that the workflow is only processing the expected entries. In this case, the Wolfskin, Inc. invoice is the only one that this workflow instance has interacted with so far.


Click image to view larger in a new window.
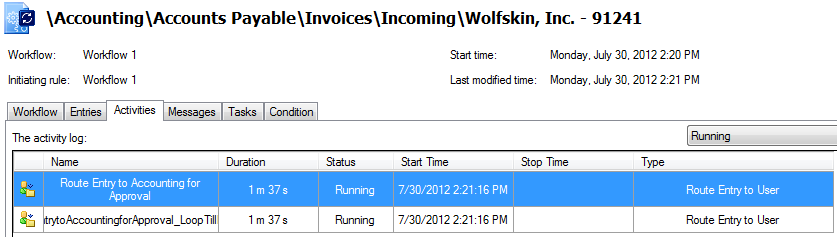
- The “Activities” tab lists information about all of the activities that have thus far been completed in this instance of the workflow. This can help you see exactly what has happened and if it matches your expectations. The” Activities” tab is useful when investigating the duration of a workflow or how many times an iteration, like a “For Each Value” activity, was performed. You can see a list of all activities Workflow went through or just the ones that took a relatively long time.


Click image to view larger in a new window.
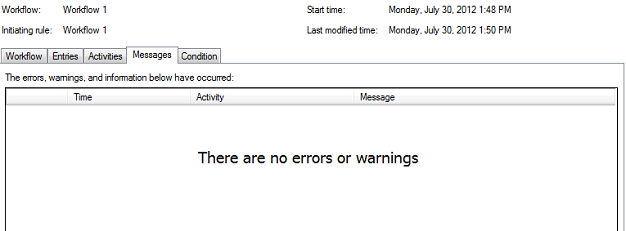
- • The “Messages” tab gives you information about all the errors and warnings that have occurred while this workflow instance was running. If your workflow terminated or has any warnings, this is the place that will show you why.


There are three types of messages that can appear in this tab:
- Informational messages do not impact the workflow in any way, but the user may find them interesting when analyzing performance.
For example, you have a workflow that searches for documents based on certain criteria and then routes them to another folder. Normally, this workflow takes ten minutes to run, but today it took three hours. You check the instance details and see that where it would usually find ten documents, today it found 300. - Warnings indicate that something occurred that impacted the execution of the rule, but Workflow was able to recover from it. Warnings are not fatal and the workflow rule will move to the next activity once the current one succeeds.For example, if a document is locked when you try to set fields on it, Workflow will log a warning, wait 5 minutes and then try again.
- Errors occur when Workflow can’t or is unable to handle a particular issue.For example, if you try to move an entry that no longer exists, Laserfiche Server will return an “Entry Not Found” error. Errors are usually fatal, causing the workflow instance to terminate.
Coming back to our original example, we do not have any messages associated with that particular workflow instance.


- Informational messages do not impact the workflow in any way, but the user may find them interesting when analyzing performance.
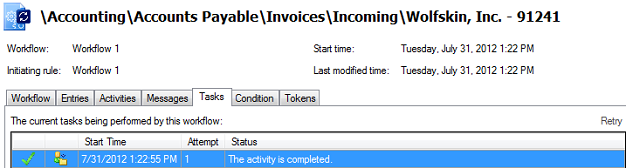
- The “Tasks” tab displays activities that have the potential to be long-running, along with their statuses. Most of the time this tab will be empty, but in this case you can see that the invoice has been approved by Purchasing on the first attempt.


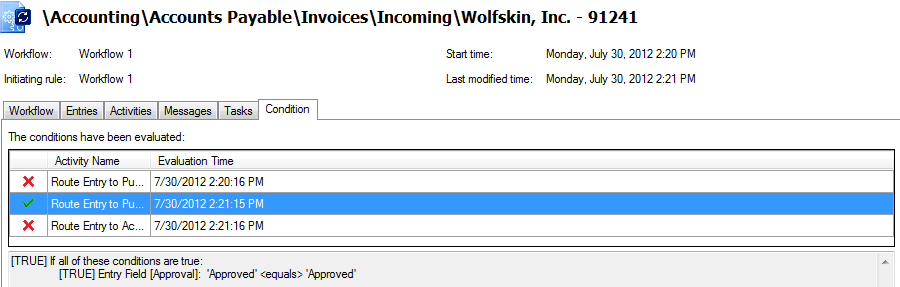
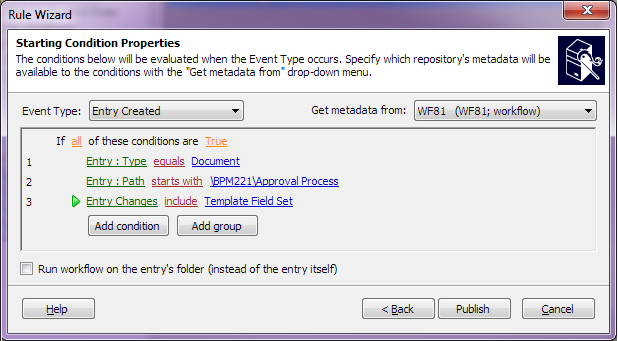
- The “Condition” tab specifies the particular conditions that have been evaluated and if they have been met. For each evaluation, you’ll be able to see the result and what the values were at the time.


Click image to view larger in a new window.
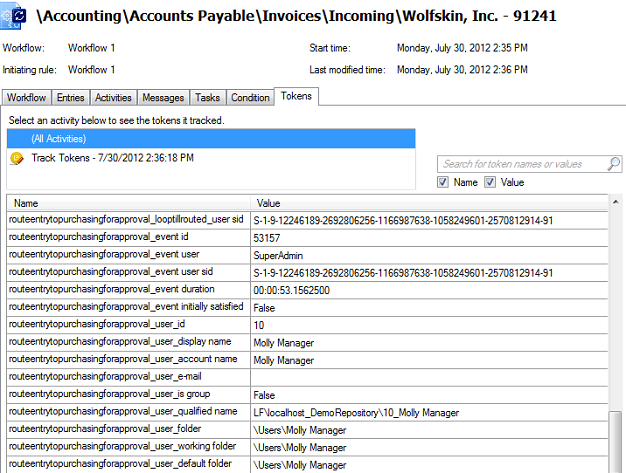
- Laserfiche Workflow 8.3 allows the user to log the values of tokens at specific stages in the workflow for debugging purposes. To do so, you can use a “Track Tokens” activity. The activity can be configured to either log all tokens or specific ones. You can use it to double-check that token values are what you expect them to be. Once the activity runs, you can see the recorded token values in the “Tokens” tab in the instance details. You have an option for seeing all values or just the ones logged at a particular stage. In this case, we’re displaying all the tokens.


Coming back to our original example, Workflow 1 seems to be running correctly. The reason that the invoice is not yet in the “Invoices – Approved” folder is that Accounting hasn’t approved it yet. Following up with the accounting department should resolve the issue.
Scenario 2: Your workflow is not starting
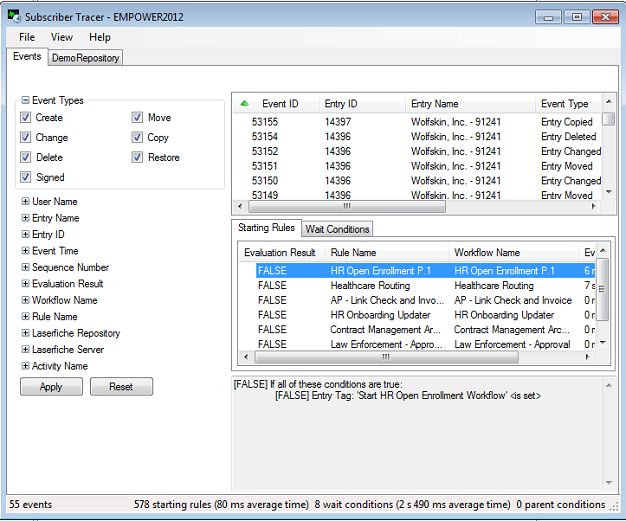
One of the most common issues that users encounter is their workflow looking like it has not even started when it should have. Whenever you’re looking into why a workflow did not start, look at the Subscriber Trace available from the Workflow Administration Console “Monitoring – Subscribers” node.
Using the Subscriber Trace you can see the results of your starting rules:
- If your workflow failed to start because the starting rules weren’t evaluated correctly.
- If more than one workflow started on the same document (leading to your workflow appearing not to have started because the entry will not end up where you would expect it).
When you open the Subscriber Trace, you’ll see multiple tabs:
- Events.
- Repository.
The “Events” tab shows you each event that happened, how many starting rules were evaluated and the results of the evaluation. You can also view other parameters that relate to the event like the type (such as Entry Copied) and the user who generated it (such as Workflow User), as well as how long the evaluation took. Notice that some conditions take no time at all (like the name, path and user), while others take much longer and are more expensive because Workflow has to call into Laserfiche to get more information on the entry (like fields or folder counts).
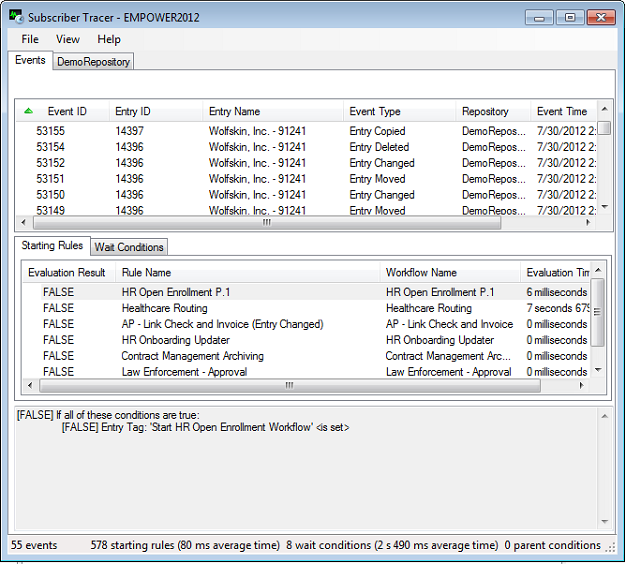
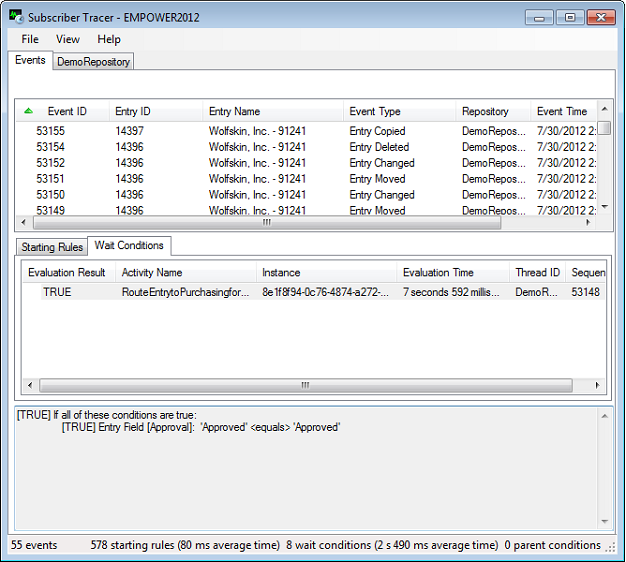
You can also filter the results by different Event Types or Workflow parameters.
The “Repository” tab gives you graphical indications of the number of events that occurred in your repository recently and the current load on your Workflow Subscriber. There will be a separate tab for each repository your Workflow Subscriber monitors.
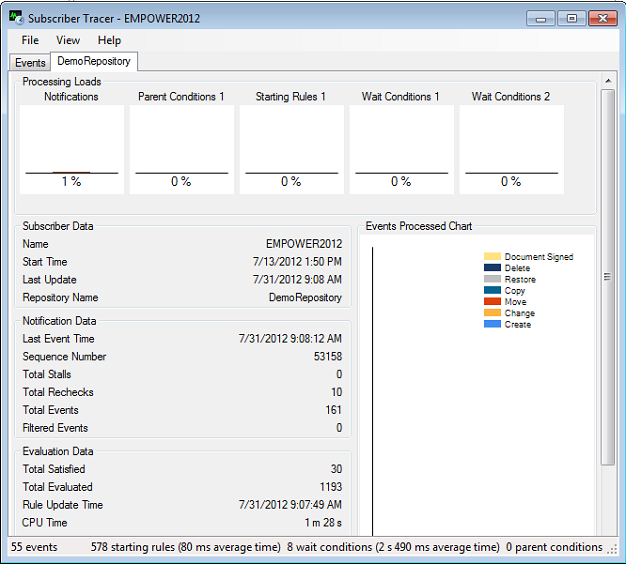
For example, a high load on the notification thread would indicate that the Subscriber has a lot of events to process which may be the reason your workflow hasn’t started yet.
Scenario 3: Too many instances of the same workflow are starting
Another case where the starting rules may be to blame is if you get too many Workflow instances started on the same document. They can be separate instances of different rules or they can be multiple instances of the same rule. The latter happens when your starting rulesare not specific enough or are configured incorrectly.
You can check on your Workflow Server by running a statistics report from the “Monitoring – Statistics” node in the Workflow Administration Console. A statistics report aggregates data about each workflow:
- The number of entries that ran through each rule.
- The status of the workflow instances.
- The duration of the workflow instances.
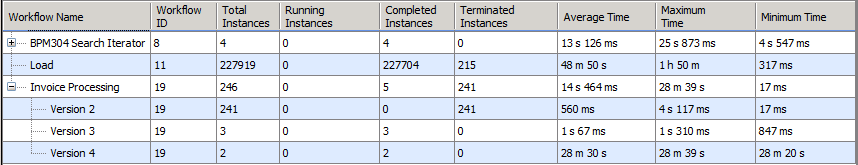
Click image to view larger in a new window.
You know there may be something wrong with your starting rule if:
- Your workflow ran a very large number of times. For example, you can see that the “Load” workflow in the screenshot above ran over 200,000 times.
- If you notice a very large number of terminated instances.
As you’ve seen in the Subscriber Trace, for each event type, Workflow evaluates all starting rules associated with it. In order to prevent conflicts, you want your rules to be as specific as possible:
- If only documents are supposed to trigger the workflow, add a condition on the document type.
- If only specific users should be able to start a given workflow, add a condition on the user name.
- If some users are not supposed to be able to start a workflow, exclude them from the start rule. For example, you should exclude the “Workflow” user to prevent your workflow from starting accidentally based on the action of some other workflow.
You should also order the conditions based on their cost or how long it usually takes to evaluate them:
- Entry name and path conditions are inexpensive since Laserfiche sends that information over with the notification.
- Field conditions can come next as they require a call to Laserfiche to retrieve the field values for that entry.
- Folder content conditions are most expensive since they need to calculate the number of documents in a given folder.
You should also put the conditions least likely to succeed at the top because, once a condition evaluates to false, the entire rule evaluates to false. In this way, Workflow will be more efficient since it will not always have to evaluate all conditions.
Narrow down which entry change events should trigger Workflow. For example, if your Workflow should only start when a template field is set, you can specify that.
Summary
Monitoring your workflows regularly using the Workflow Administration Console can give you an idea of regular patterns and can help you catch and diagnose unusual issues quickly. Workflow’s comprehensive search functionality allows you to delve down and investigate specific entries and pinpoint the actual cause of a problem or bug.